
Traditional metrics often fail to capture the true essence of online student learning. This guide explores how to build progress reports that reflect genuine growth, blending data with insight.
Establishing Meaningful Metrics for Online Learning Progress
As online educators, we've all been there - staring at a screen full of submission timestamps and quiz scores, wondering what this data actually tells us about our students' learning journey. Traditional metrics often fall short in virtual classrooms where we can't see puzzled expressions or moments of enlightenment. Let's dive into how you can create progress reports that genuinely reflect student growth in online environments.
Balancing quantitative data with qualitative insights
Raw numbers only tell half the story. While completion rates and time-on-task are easy to measure, they don't capture the quality of a student's understanding. Try this approach instead:
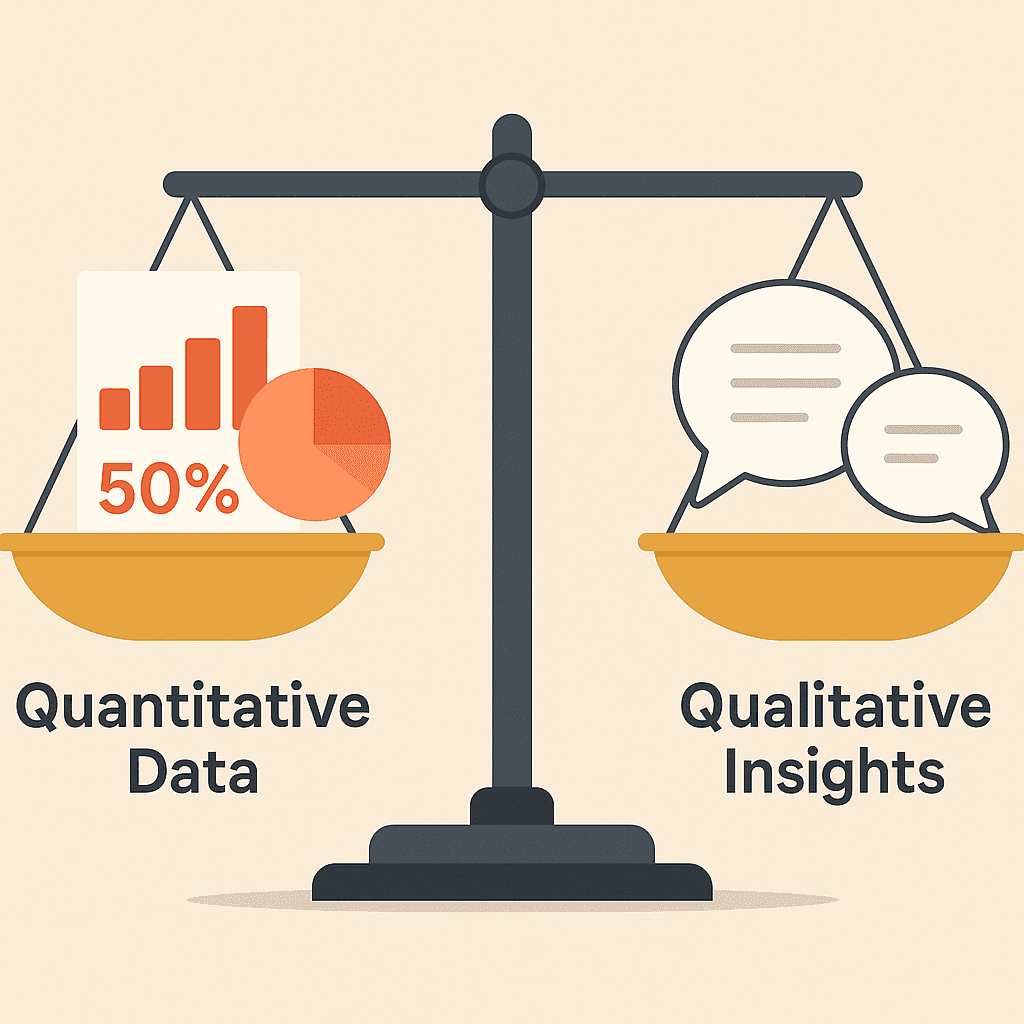
Pair each numerical metric with a qualitative observation
Track not just if assignments were completed, but how they were approached
Note patterns in student questions and comments during live sessions
Record improvements in the depth of discussion board responses
For example, instead of just noting "Completed 8/10 assignments," add context: "Completes assignments consistently but discussion responses have become more thoughtful and detailed over the past month."
Key performance indicators that actually matter in virtual environments
Not all data points deserve equal attention in your progress reports. Focus on these metrics that truly reflect online learning progress:
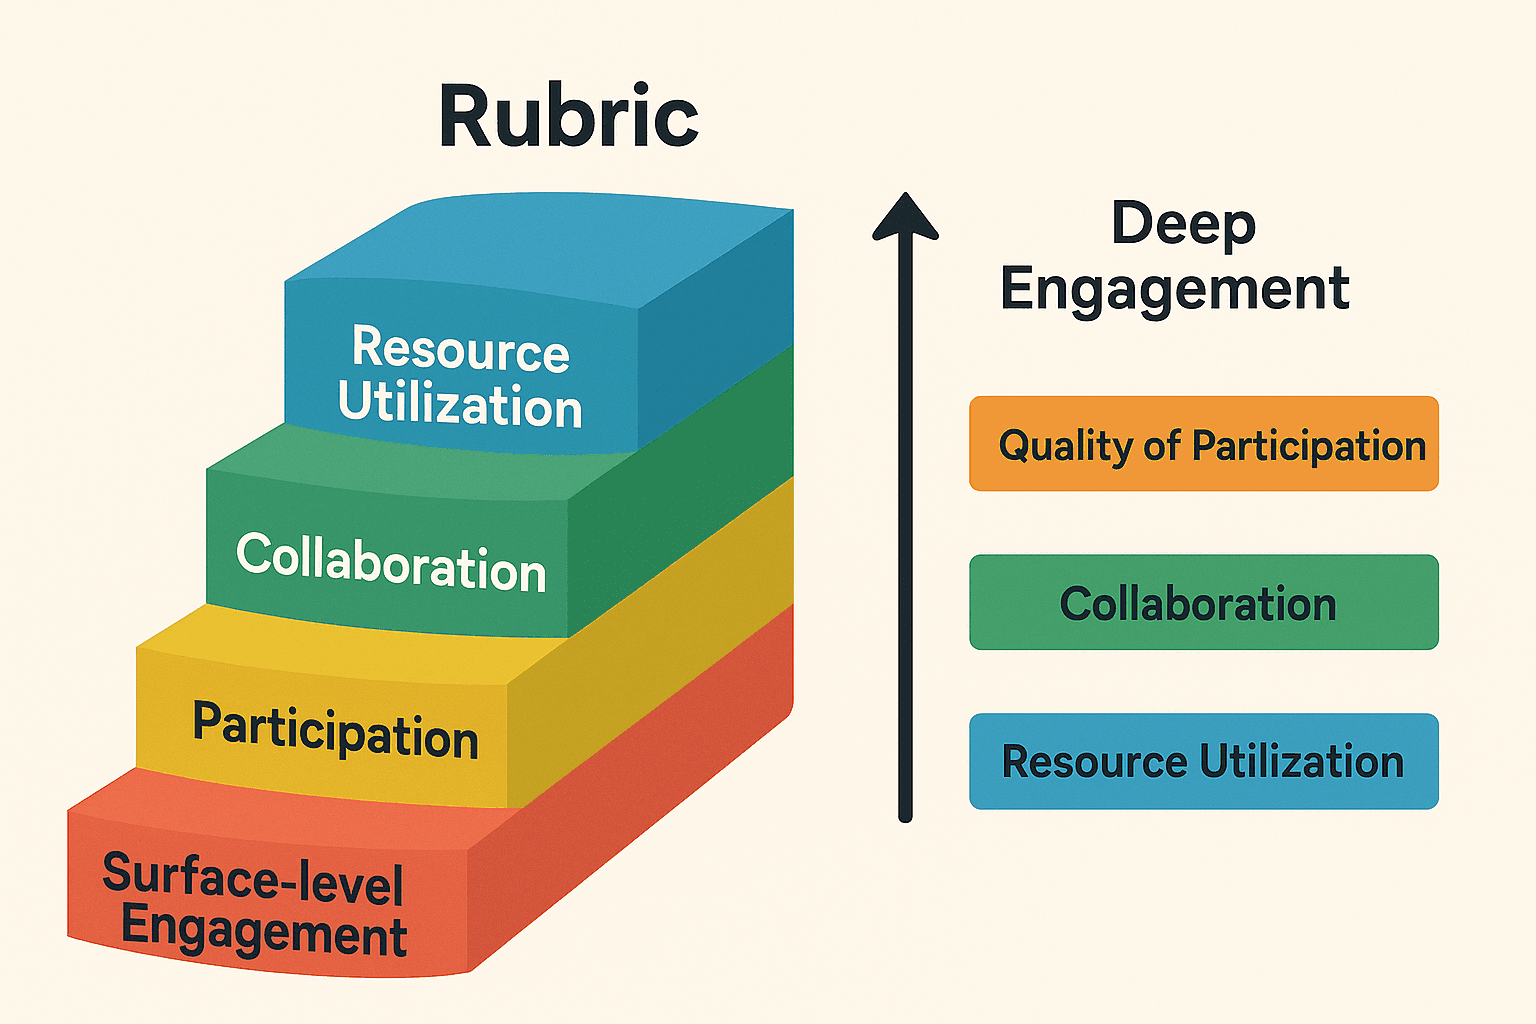
Creating custom rubrics that assess engagement, not just submissions
Standard rubrics often miss the nuances of online learning. Design custom assessment frameworks that capture:
Quality of participation - Differentiate between "posted required response" and "extended the conversation meaningfully"
Digital collaboration skills - Assess how students work together in breakout rooms or asynchronous team projects
Resource utilization - Track which supplementary materials students access and how they incorporate these into their work
Technological adaptability - Measure how students leverage various platform tools to enhance their learning
A thoughtful rubric makes grading more efficient while providing students with clear expectations for meaningful participation beyond just showing up.
Tracking patterns over time vs. isolated assignment scores
Single data points can be misleading. A student might ace one quiz but struggle with the concept in practical application. In your progress reports:

Display trendlines rather than individual scores
Group related skills to show mastery development across different contexts
Highlight improvement rates rather than absolute performance
Flag inconsistent performance patterns that might indicate specific challenges
This approach helps identify which students are genuinely building understanding versus those who might be temporarily memorizing information but not integrating it.
Using integrated analytics tools to monitor student development
Take advantage of your learning management system's built-in analytics. Most platforms offer:
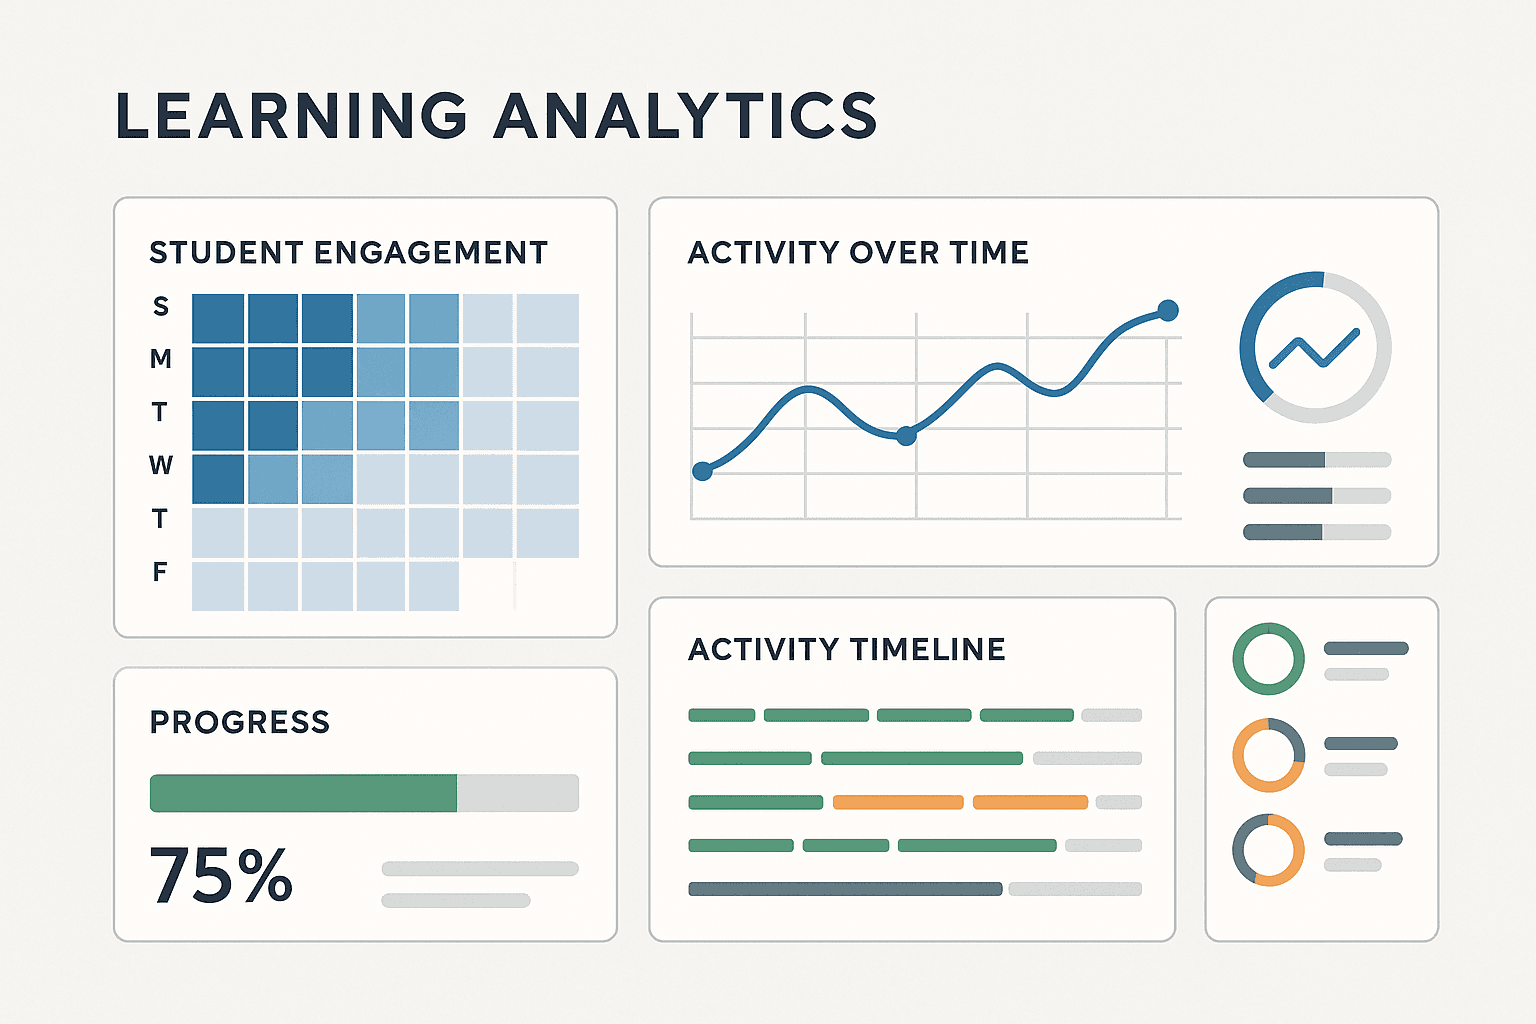
Comprehensive activity logs showing when and how students engage
Heat maps revealing which course materials receive the most attention
Progress tracking across multiple assignments and assessments
Early warning indicators for students falling behind
These tools can automatically generate visual representations of student progress that make patterns immediately apparent - saving you hours of manual data compilation.
Remember that the best metrics capture not just what students have completed, but how they're evolving as learners. By focusing on meaningful data points rather than simple completion statistics, your progress reports will provide genuine insight into student development in the online environment.
The next time you prepare student progress reports, ask yourself: "Does this information help me understand how this student is actually learning?" If not, it might be time to reconsider which metrics deserve your attention.## Crafting Progress Reports That Drive Student Improvement
Creating progress reports that actually help online students improve isn't just about dumping data into a template. Your reports need to give students clear insights and actionable steps. Here's how to craft reports that make a real difference.
Templates and Frameworks That Combine Data Visualization with Personalized Feedback
Most students shut down when faced with walls of text or endless numbers. Try these approaches instead:
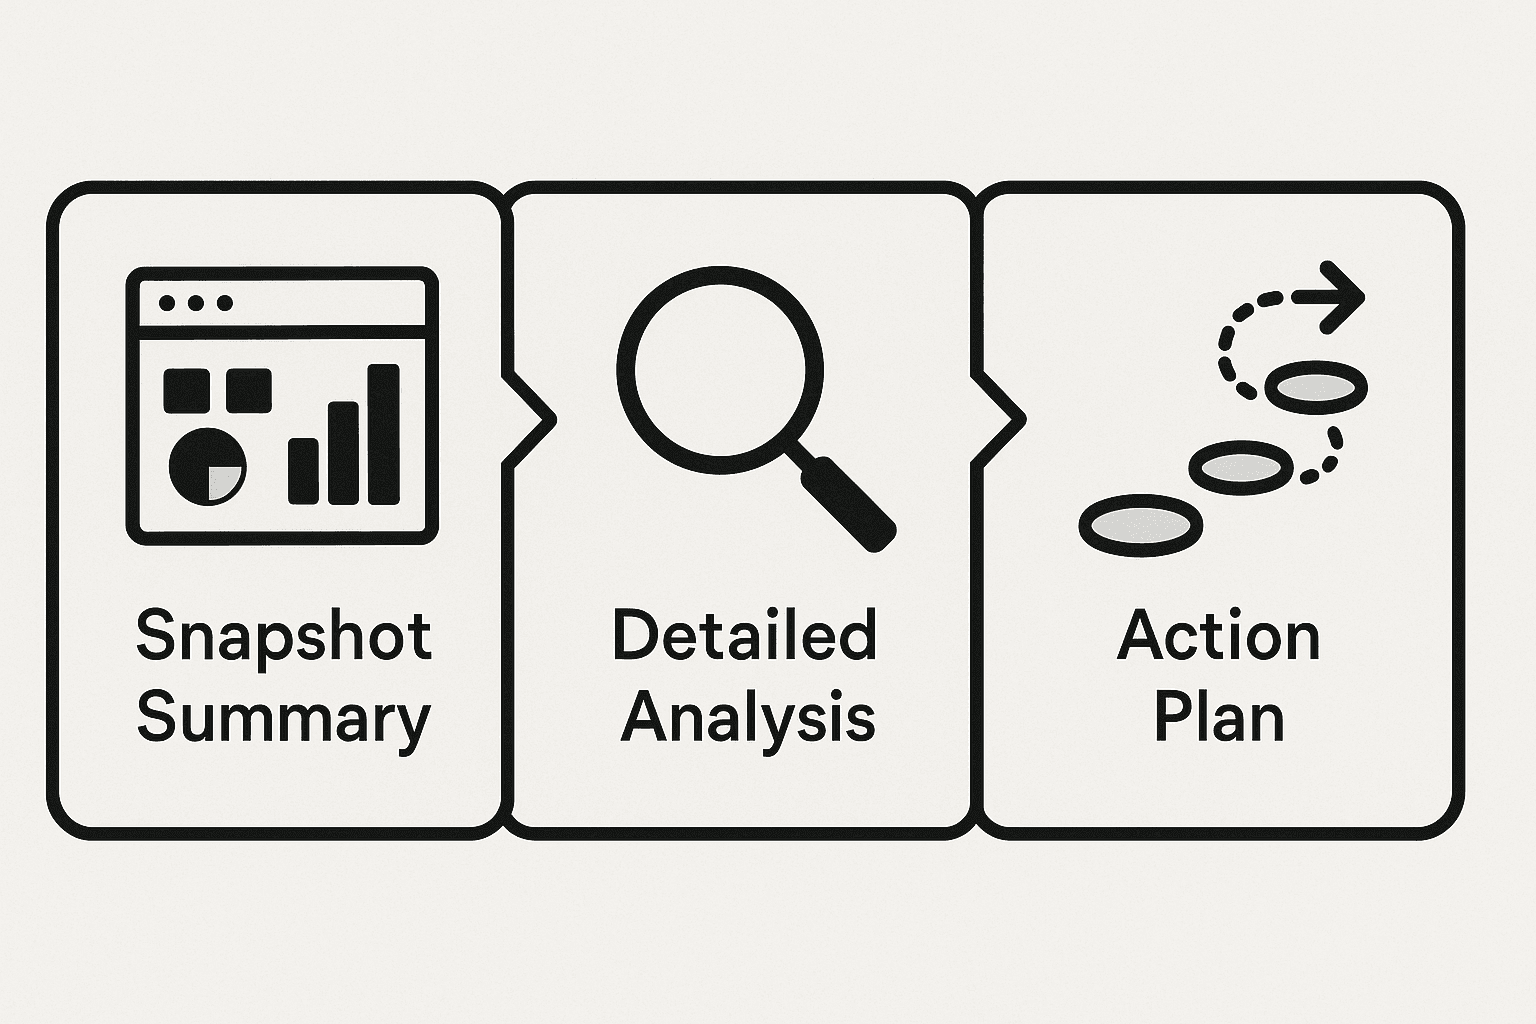
The 3-Part Report Structure
Snapshot Summary - A visual dashboard showing overall progress at a glance
Detailed Analysis - Breakdown of specific strengths and areas for improvement
Action Plan - Concrete next steps for the student
Visual elements grab attention and help students process information quickly. Include:
Simple bar charts comparing current performance to previous reporting periods
Color-coded skill matrices (green for mastered skills, yellow for developing, red for needs attention)
Progress line graphs showing improvement over time
Pie charts breaking down time spent on different activities
Don't just add visuals for show. Each graphic should tell a story about the student's learning journey.
Writing Actionable Feedback That Addresses Specific Learning Gaps
Generic comments like "good job" or "needs improvement" don't help anyone. Instead, provide feedback that:
Points to specific examples from the student's work
Connects to clear learning objectives
Offers a concrete path forward
Look at these examples:
The right column gives students a clear picture of what they did well or poorly, and exactly what to do next.
Incorporating Student Self-Assessment Components into Reports
Students who reflect on their own learning show greater improvement than those who don't. Add self-assessment sections to your reports with prompts like:

"What was most challenging about this unit's material?"
"Which learning strategies worked well for you this month?"
"Where do you feel you made the most progress?"
"What's one specific goal you want to focus on before the next report?"
Compare student self-perceptions with your observations. When there's a gap (like a student thinking they're doing great in an area where they're struggling), that's a perfect opportunity for a one-on-one check-in.
Time-Saving Workflows for Generating Individualized Reports at Scale
Let's be real - creating detailed reports for every student can be overwhelming. Try these approaches to make it manageable:
Progressive Feedback CollectionKeep notes on student performance throughout the reporting period rather than trying to remember everything at the end. Use a simple spreadsheet with student names down the left and key skills/assignments across the top. Add quick notes when something stands out.

Comment BanksCreate a collection of well-written, specific comments for common situations. You'll still need to personalize them, but having solid starting points saves tons of time.
Batch ProcessingGenerate reports by type of feedback rather than by student. For example, review all discussion participation at once, then move to assignment scores, etc. This keeps you focused and efficient.
Partial AutomationUse your LMS to pull quantitative data automatically. Many systems can generate basic reports showing grades, login frequency, and submission timeliness. You can then focus your energy on adding the qualitative insights computers can't provide.
Case Study: Effective Progress Reporting in Action
A math instructor teaching online calculus noticed her students were struggling with motivation. She redesigned her progress reports to highlight growth rather than just correctness.
Her new reports included:
A "growth tracker" showing improvement in problem-solving speed
Specific examples of complex problems the student solved correctly
Comparisons to the student's own previous performance (not to other students)
A "challenge corner" with one slightly advanced concept to explore before the next report
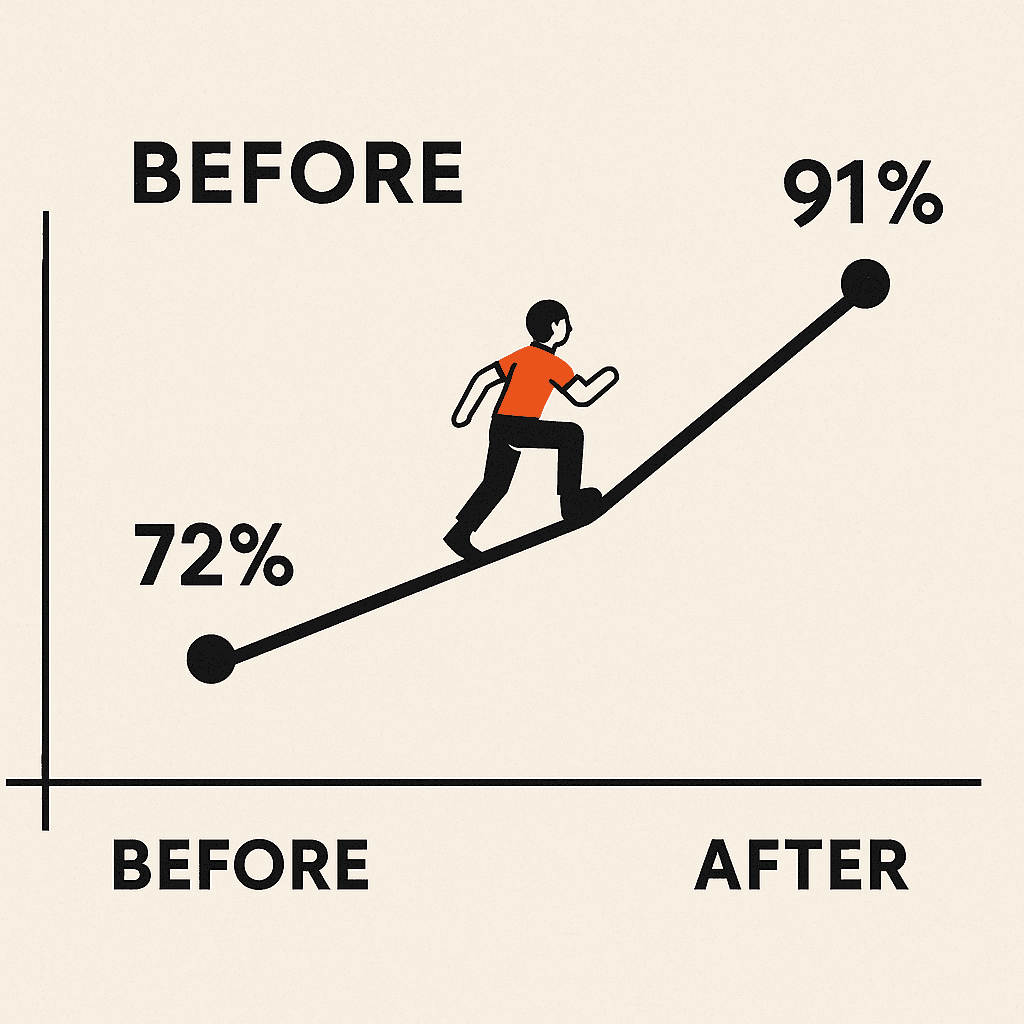
After implementing these changes, student completion rates jumped from 72% to 91%. In surveys, students mentioned feeling more confident and having clearer direction on what to study.
The most powerful progress reports don't just look backward - they give students a map for moving forward. By combining clear data visualization, specific actionable feedback, student reflection, and efficient workflows, you'll create reports that actually drive improvement instead of just documenting performance.## III. Implementing Effective Delivery and Follow-up Strategies
Once you've gathered all the right data and created insightful progress reports, your next challenge is making sure they actually reach and impact your online students. Let's dive into how to deliver these reports in ways that drive real improvement.
Optimal timing and frequency of progress reporting for online learners
Online students easily lose track of their own progress without the regular face-to-face check-ins of traditional classrooms. Finding the right rhythm for your progress reports can make all the difference.
Weekly mini-reports combined with monthly comprehensive assessments tend to work best for most online courses. Weekly touchpoints help students stay on track, while monthly deeper dives give them perspective on longer-term trends.
A teacher named Jamie shared this approach: "I send quick progress snapshots every Monday morning - just three bullet points on what they did well, what needs work, and one specific goal for the week. Then at the end of each month, they get the full picture with charts showing their growth over time."
Avoid sending reports right after major assignments or exams when students might be emotionally charged. Instead, give a day or two for emotions to settle before delivering feedback.
And remember - consistency matters more than frequency. Students do better when they can count on feedback arriving on a predictable schedule.
Creating two-way communication channels to discuss progress findings
Progress reports shouldn't be a one-way street. When students can respond, ask questions, and share their perspective, they take ownership of their learning.

Try these practical approaches:
Include specific questions at the end of each report: "What part of this feedback surprises you?" or "What support do you need to improve in this area?"
Set up 10-minute video check-ins where students can discuss their reactions to the progress report
Create a dedicated discussion board where students can share strategies based on their reports
Use collaborative goal-setting documents where both you and the student can track next steps
A special education teacher who switched to online teaching told me: "I started using Google Forms to gather students' thoughts on their progress reports. The questions are simple: 'What's one thing you're proud of?' and 'What's one area you want help with?' These responses guide our next one-on-one meeting and save us both time."
Using progress data to implement targeted intervention strategies
The real power of progress reports lies in what happens next. Your reports should directly inform how you adapt your teaching to meet student needs.

Here's how to turn insights into action:
Remember that good intervention strategies build on strengths while addressing weaknesses. The data from progress reports helps you spot both.
A math teacher shared: "I noticed three students were struggling with the same concept according to their progress data. Instead of helping them individually, I created a small breakout group during our next class. They worked through problems together, and all three improved on the next assessment."
Measuring the effectiveness of your reporting methods through student outcomes
How do you know if your progress reports are actually helping? Look for these signs:
Engagement metrics improve - Students spend more time on task after receiving reports
Self-assessment accuracy increases - Students' perceptions of their work align more closely with actual performance
Questions become more specific - Instead of "Why did I get a B?" students ask "How can I improve my analysis of primary sources?"
Students refer back to previous reports - They connect current work to past feedback
Improvement in targeted areas - When you highlight a specific skill gap, you see focused progress in that area
Don't forget to ask students directly about the usefulness of reports. A simple survey with questions like "How helpful were the visual elements in understanding your progress?" or "What part of the progress report helped you most?" can guide your approach.
One psychology professor found that switching from text-only reports to ones with visual progress bars increased student response rates from 40% to 78% - clear evidence that format matters.
Leveraging assignment-tracking features to correlate attendance with performance improvement
Most online learning platforms offer robust tracking features. Use them to understand the relationship between engagement and results.
Pull these key metrics to enhance your progress reporting:
Time spent in the learning management system vs. assignment scores
Participation in discussion forums vs. concept mastery
Attendance at live sessions vs. project quality
Video watch completion rates vs. quiz performance
These correlations help students see concrete connections between their effort and outcomes.
A community college instructor noticed students who watched at least 85% of lecture videos scored an average of 12 points higher on assessments. She added this data point to progress reports, which motivated more students to watch videos completely instead of skimming.
The delivery of your progress reports isn't just an administrative task - it's a teaching opportunity. When done right, the way you share progress information becomes as important as the information itself. Your thoughtful approach to delivery and follow-up shows online students they matter as individuals in a learning environment that can sometimes feel impersonal.
Remember that good progress reporting creates a continuous feedback loop. The reports inform your teaching strategies, which improve student performance, which generates better data for future reports.
