
Tracking engagement in online lessons is no longer guesswork - it’s data-driven. This guide explores the best digital tools and strategies educators can use to measure and improve student participation in virtual classrooms.
Effective Digital Tools for Measuring Student Engagement
The shift to online learning has created new challenges for educators trying to gauge student participation. Unlike physical classrooms where you can see raised hands and engaged faces, virtual environments require different tools to measure involvement.
Real-time Participation Tracking Platforms
Popular video conferencing platforms now offer built-in analytics that can transform how you monitor student engagement:
Zoom AnalyticsZoom provides detailed reports showing who attended your session, for how long, and even attention tracking metrics. You can see:
Attendance duration for each student
Chat participation levels
Poll response rates
Raised hand counts
Google ClassroomGoogle Classroom tracks:
Assignment submission rates
Comment activity on posts
Time spent on materials
Student login frequency
Microsoft TeamsTeams offers comprehensive analytics including:
Video-on time percentages
Speaking time distribution
Chat participation metrics
Reaction usage
These platforms give you a baseline understanding of who's showing up and how they're interacting with your virtual classroom environment.

Specialized Education Platforms with Built-in Analytics
Domain-specific teaching platforms often provide more nuanced engagement tracking tailored to your subject area.
For example, chess coaches using ChessPlay.io can track multiple dimensions of student engagement during online lessons. The platform's Interactive Q&A system displays real-time participation as students attempt to solve positions on their boards. Coaches see exactly who's responding to questions and can identify patterns in participation.
What makes specialized platforms valuable is their ability to measure engagement through subject-specific activities rather than generic metrics like "time online." ChessPlay.io's system awards points for correct answers and response speed, creating a live leaderboard that motivates students to stay engaged throughout the lesson.
Interactive Polling and Quiz Tools
Embedding interactive elements into your lessons creates natural checkpoints for measuring engagement:
Kahoot!
Tracks percentage of questions answered
Measures response time
Shows accuracy rates
Ranks student performance
Mentimeter
Real-time response visualization
Participation rates by question
Word cloud engagement metrics
Anonymous feedback options
Poll Everywhere
Live response tracking
Segmented participation data
Export options for long-term analysis
Integration with presentation software
These tools don't just measure engagement - they create it. By turning passive learning into active participation, polls and quizzes generate the very metrics you need to track.

Learning Management Systems with Analytics Dashboards
LMS platforms serve as central hubs for organizing and tracking all aspects of online teaching:
The advantage of LMS analytics is their ability to track engagement across all course activities, not just during live sessions. This helps you identify students who may interact with materials outside of class hours.
Digital Discussion Boards with Engagement Metrics
Discussion boards create asynchronous engagement opportunities that can be precisely measured:
Padlet
Post frequency
Comment chains
Reaction usage
Media contribution rates
Flipgrid
Video response completion
Peer feedback metrics
Viewing statistics
Follow-up engagement
Discord/Slack for Education
Channel activity tracking
Direct message engagement
Reaction usage statistics
File sharing participation
Discussion boards are particularly valuable for tracking participation from quieter students who might not speak up during live sessions but engage thoughtfully in written formats.
Making Tool Selection Work for Your Teaching Style
When choosing engagement tracking tools, consider these questions:
What specific student behaviors indicate engagement in your subject matter?
Do you need real-time metrics or is asynchronous tracking sufficient?
How will you use the collected data to improve your teaching?
Will students benefit from seeing their own engagement metrics?
The best approach often combines multiple tools. For instance, many chess coaches use ChessPlay.io's subject-specific engagement metrics during lessons while also tracking broader course participation through an LMS.

Remember that the goal isn't just collecting data - it's using that information to identify students who need additional support and to refine your teaching approaches for better engagement overall.
By implementing these digital tools strategically, you'll gain clear visibility into how students are participating in your online lessons, allowing you to make informed adjustments that boost both engagement and learning outcomes.
Proven Methods for Quantifying Online Participation
Tracking student engagement in online lessons can feel like trying to catch smoke with your hands. Without the benefit of seeing nodding heads or confused faces in a physical classroom, how do you know if your teaching is hitting the mark?

Creating Measurable Participation Rubrics with Clear Expectations
The foundation of tracking participation starts with clear expectations. Students can't hit a target they can't see.
A good participation rubric breaks down exactly what engagement looks like in your online environment:
Make sure to share this rubric with students before your first online lesson. When everyone knows the game's rules, they're more likely to play along.
Implementing Active Learning Checkpoints Throughout Lessons
Breaking your lesson into bite-sized chunks with engagement opportunities helps maintain attention and provides multiple data points for measuring participation.

Effective checkpoints include:
Quick polls every 10-15 minutes
Mid-lesson knowledge checks using brief quizzes
Digital hand-raising for understanding checks
"Rapid response" activities where everyone answers at once
Breakout room discussions with specific deliverables
For example, at ChessPlay.io, chess coaches use interactive puzzles as natural checkpoints in their online lessons. Students solve positions directly on their digital boards, giving coaches immediate feedback on who's following along and who's struggling.
"We found that asking students to make a move on the board every 5-7 minutes keeps them engaged and provides us with concrete data on participation," explains one chess coach who uses the platform. "It's like taking attendance multiple times per class, but in a way that actually enhances learning."
Developing Peer-to-Peer Accountability Systems
Sometimes the best motivation comes from classmates, not teachers. Building peer accountability into your online lessons creates a self-sustaining engagement ecosystem.
Consider these approaches:
Assign "participation partners" who check in with each other
Create small study teams responsible for everyone's participation
Implement structured peer review sessions
Use collaborative projects that require input from all team members
Design student-led discussion days where peers moderate
The data from these interactions serves as valuable engagement metrics. Track which students are connecting, how often they communicate, and the quality of their interactions.
Leveraging Gamification Elements to Boost Engagement Metrics
Nothing drives participation quite like turning learning into a game. Gamification provides both motivation for students and measurable data points for teachers.
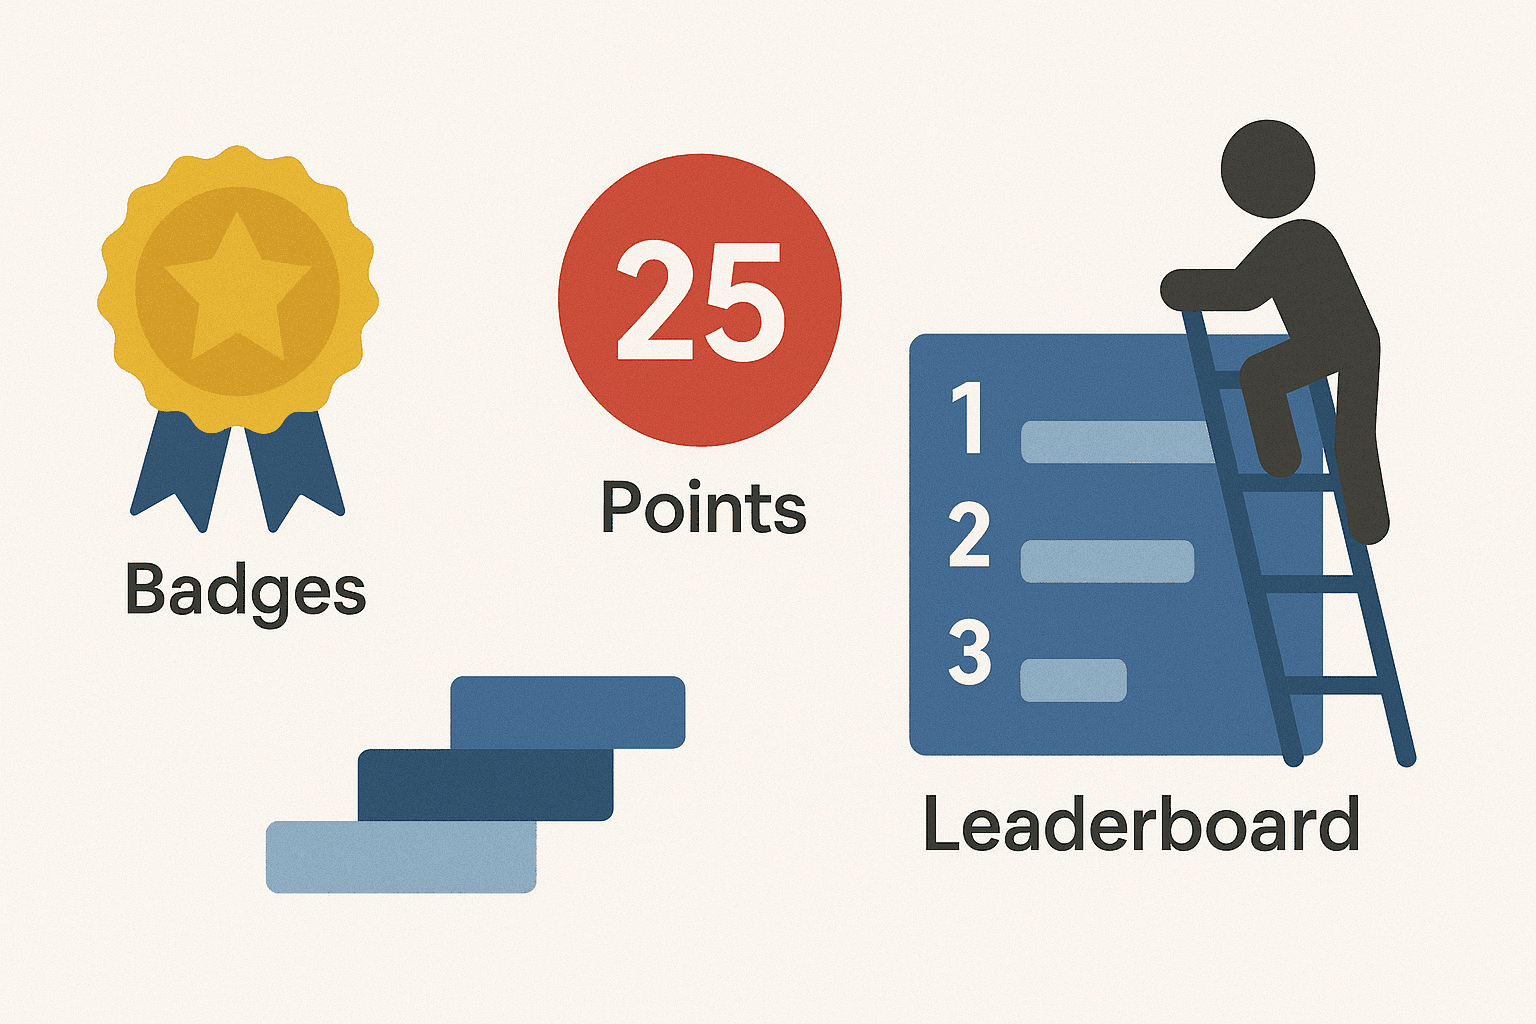
ChessPlay.io's approach to gamified learning shows how effective this can be. Their interactive Q&A system awards points based on both accuracy and speed of response during online chess lessons. As students answer questions, a live leaderboard updates in real-time, creating friendly competition.
You can implement similar systems by:
Creating point systems for participation and correct answers
Building leaderboards for various activities
Awarding virtual badges for consistent engagement
Designing level-up systems based on participation metrics
Introducing friendly team competitions
The beauty of gamification is that it automatically generates participation data. Every point, badge, or leaderboard position represents a measurable engagement action.
Using Heatmaps and Video Analytics to Measure Attention Spans
For more sophisticated tracking, consider the digital footprints students leave during your online lessons.
Modern video conferencing and learning platforms often provide analytics like:
Attention tracking (whether your meeting tab is active)
Time spent on page or in specific activities
Mouse movement heatmaps showing where attention goes
Video view percentages (how much of recorded content was watched)
Multi-tasking detection
These passive metrics complete the picture when combined with active participation measures. They help identify students who might be technically "present" but mentally elsewhere.
Establishing Effective Synchronous vs. Asynchronous Tracking Methods
Different types of online learning require different measurement approaches:
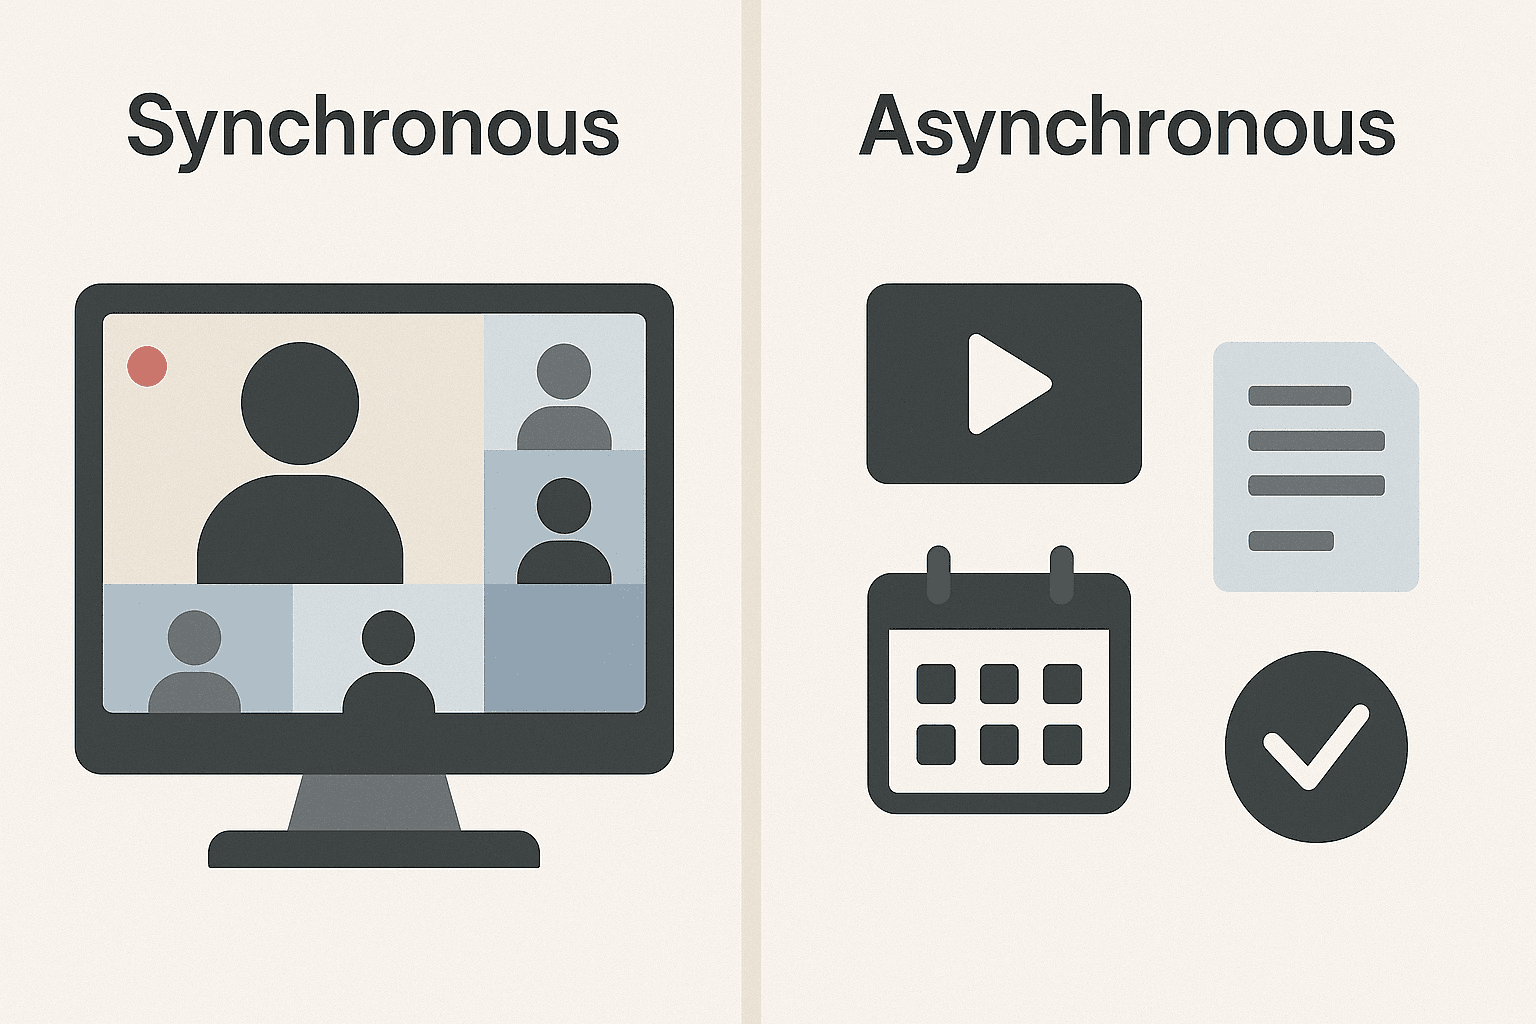
For synchronous (live) sessions:
Track real-time responses and questions
Monitor chat activity and participation
Record raised hands and voluntary contributions
Note camera-on time (if appropriate for your setting)
Measure breakout room participation
For asynchronous learning:
Set deadlines and track completion times
Monitor discussion board posts and replies
Check video view completions and patterns
Track login frequency and time spent in the learning environment
Measure resource access (downloads, page views)
Chess academies using ChessPlay.io combine both approaches - tracking live participation during online lessons while also monitoring how students engage with assigned puzzles and practice sessions between classes. This creates a comprehensive picture of each student's engagement patterns.
Designing Meaningful Participation Assignments That Generate Data
Not all participation activities are created equal. The best ones both enhance learning and provide clear engagement metrics.
Effective assignments include:
Interactive assessments that require multiple submissions
Digital portfolio entries with peer comments
Student-created content that demonstrates understanding
Discussion prompts requiring substantive responses
Problem-solving tasks with visible thinking processes
Chess coaches on ChessPlay.io, for example, assign puzzle sets tailored to each student's level. The platform tracks not just completion, but also time spent, number of attempts, and improvement over time. This rich data helps coaches identify which students are deeply engaging with the material versus those merely checking boxes.
When designing your own participation assignments, ask yourself: "What measurable actions will students take while completing this task?" The more concrete the actions, the better your participation data will be.
Measuring online engagement isn't about surveillance - it's about ensuring no student gets left behind in the digital classroom. By implementing these proven methods, you'll gain insight into who's actively learning and who might need additional support. The quantitative data these approaches generate allows for timely interventions and continuous improvement of your teaching methods.
What participation tracking methods have worked best in your online teaching? We'd love to hear your experiences in the comments below!
Interpreting and Acting on Engagement Data
The true power of tracking online participation doesn't come from simply collecting data - it comes from understanding what that data means and taking meaningful action. Let's explore how to transform your raw engagement metrics into tangible improvements for your online lessons.
Identifying Patterns of Disengagement Before Performance Drops
Most educators know the feeling: a student who was once engaged suddenly starts to struggle. But what if you could spot the warning signs before grades decline?
Early warning indicators typically appear in your engagement data weeks before they show up in academic performance. Here's what to watch for:
Decreased login frequency - When a normally active student's logins drop by 30% or more
Shorter session durations - Students spending significantly less time on assignments
Participation dropoffs - Fewer responses in discussions or live sessions
Assignment delays - Starting work closer to deadlines than usual
Reduced resource access - Not reviewing supplemental materials

At ChessPlay.io, chess coaches use our analytics dashboard to spot these patterns quickly. For example, when a student who normally completes 15-20 puzzles weekly suddenly drops to just 3-4, our system flags this change, allowing coaches to reach out before the student falls behind.
Implementing Intervention Strategies Based on Participation Metrics
Once you've identified a potential engagement issue, what next? Here are effective intervention approaches based on specific participation data:
Chess academies using our platform have found particular success with our interactive Q&A feature during live classes. When participation data shows a student is disengaging, coaches can direct questions their way or pair them with a more engaged peer for a quick challenge.
Providing Personalized Feedback Using Participation Data
Generic feedback rarely sparks reengagement. Instead, use your participation data to craft responses that acknowledge specific student behaviors:
"I noticed you solved the first three problems quickly but spent extra time on problem four. Let's discuss that concept in our next session."
This approach shows students you're paying attention to their individual learning journey, not just their final answers.
For example, chess coaches on ChessPlay.io can see exactly which types of puzzles a student struggles with. Rather than saying "practice more tactics," they can say "I see you're solving knight fork puzzles quickly, but spending extra time on discovered attacks. Let's focus there in our next lesson."
This level of specificity makes feedback feel personal and actionable, increasing the likelihood of reengagement.

Analyzing Comprehensive Student Performance Reports
The most valuable insights often come from connecting multiple data points. When reviewing student performance reports, look for:
Correlation between participation types and outcomes - Do students who actively use discussion boards perform better than those who only watch videos?
Time-of-day patterns - Are certain students more engaged during specific hours?
Content format preferences - Do some students engage more with visual vs. text-based materials?
Chess academies using ChessPlay.io's performance reports have discovered fascinating patterns. One coach found that students who regularly reviewed their game analysis showed 40% higher engagement in live classes - suggesting that self-reflection activities boost overall participation.
These comprehensive reports also help identify which teaching methods are most effective for different learning styles, allowing for more targeted instruction.
Adjusting Teaching Methods Based on Engagement Analytics
When your data consistently shows engagement issues with specific content or activities, it's time to rethink your approach:
Review engagement heat maps - Which parts of your lessons keep students active vs. where attention drops

One chess academy using ChessPlay.io discovered their endgame lessons had consistently lower engagement than opening theory. By adding our interactive board exercises where students had to solve positions in real-time (rather than just watching demonstrations), they saw engagement time double for those lessons.
Don't be afraid to completely redesign low-engagement activities. Sometimes a simple format change - like turning a passive lecture into an interactive challenge - can transform student participation.
Creating Data-Informed Student Support Plans
For students showing persistent engagement challenges, develop structured support plans based on their specific data patterns:
Establish baseline metrics - Document current engagement levels
Set measurable goals - Target specific improvements in participation
Schedule regular check-ins - Create accountability touchpoints
Implement scaffolded activities - Start with higher-engagement formats
Track progress weekly - Adjust approach based on response
Chess coaches using our platform have found success with mini-challenges for struggling students. For example, if a student's puzzle-solving engagement drops, their coach might create a custom set of just 5 puzzles (instead of the usual 15) focused on a topic the student previously enjoyed.
These smaller, targeted assignments help rebuild momentum and confidence, gradually bringing engagement back to normal levels.
Using Participation Trends to Redesign Course Elements
Your engagement data isn't just about individual students - it's also a roadmap for improving your entire course:
Identify your "greatest hits" - Which activities consistently generate high engagement
Spot the engagement cliffs - Where participation dramatically drops
Analyze sequence effects - How the order of activities impacts sustained engagement
Chess academies on ChessPlay.io frequently review their class leaderboard data to understand which interactive elements drive the most participation. One academy found that their daily puzzles with point rewards consistently outperformed other activities, so they integrated similar gamification elements into their homework assignments - resulting in a 35% increase in completion rates.
Remember that redesigning your course based on engagement data doesn't mean lowering standards. Instead, you're discovering the most effective ways to keep students motivated and active, which ultimately leads to better learning outcomes.
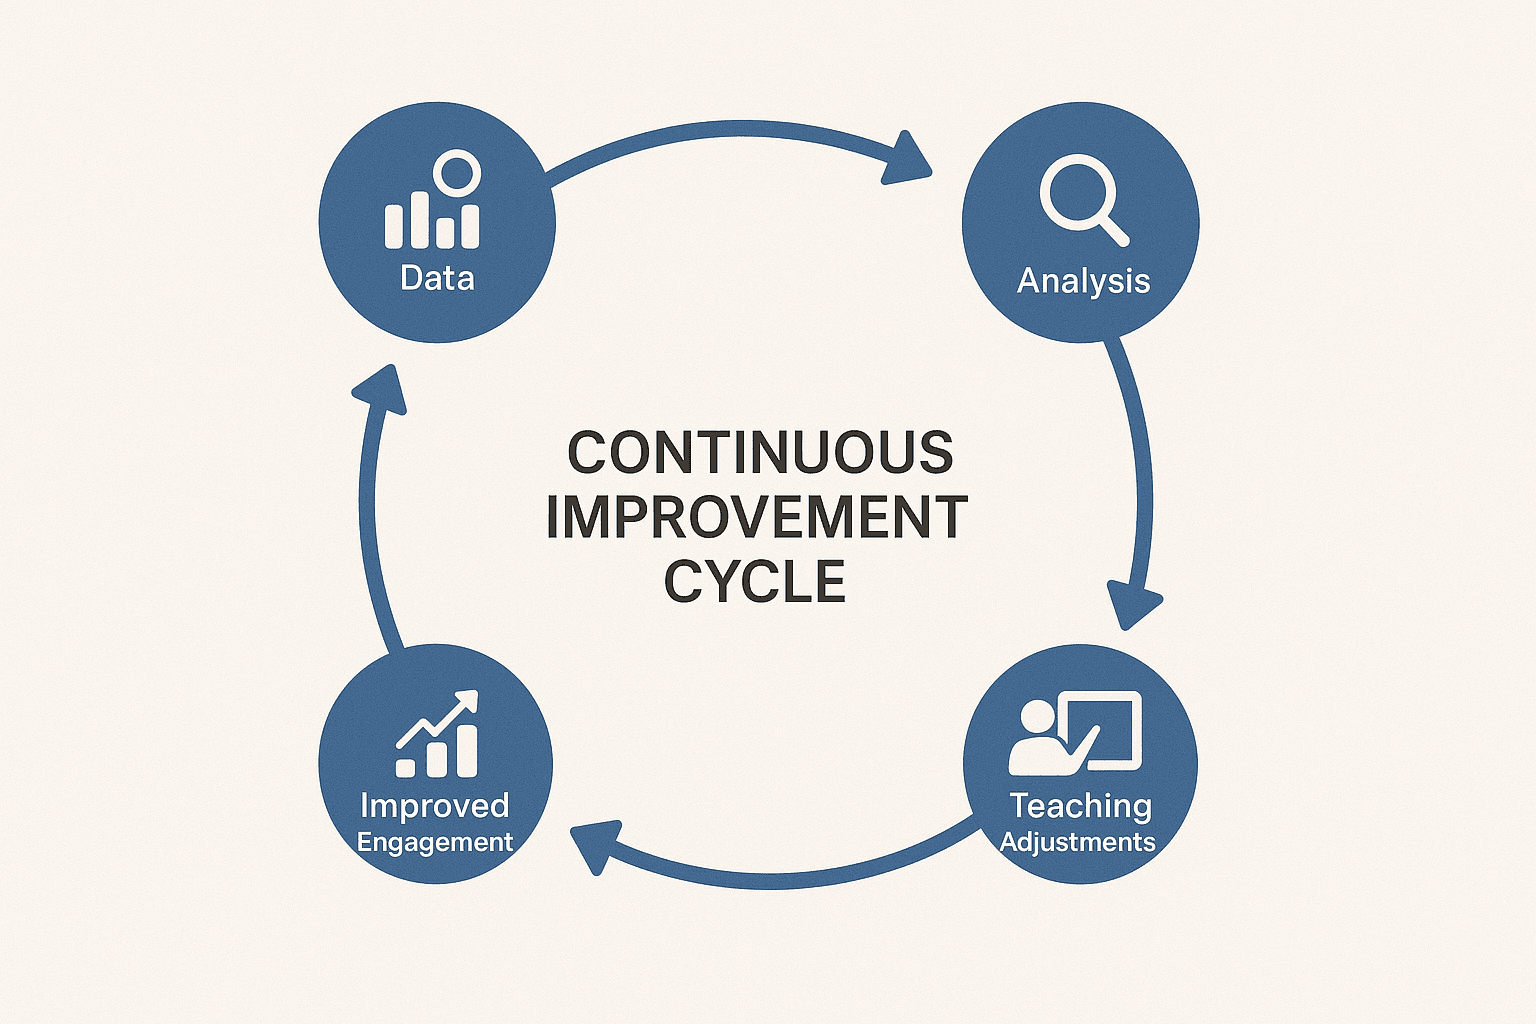
The most successful online educators don't just collect engagement data - they create a continuous feedback loop where metrics inform teaching, and improved teaching generates better metrics. By learning to interpret the signals in your participation data, you'll transform your online lessons from one-way broadcasts into dynamic, responsive learning experiences where every student feels seen and supported.